Earthquake energy begins with fault rupture, travels underground and eventually appears as oscillations in a surface record. For the same earthquake, what changes if fault slip finishes faster or more slowly? This study follows that chain through simulations of the 2022 Menyuan MS 6.9 earthquake.
From movement on the fault to shaking at the surface
A source model describes when each part of a fault starts slipping, how far it slips and how long the movement lasts. The paper uses the GP source model, varies a coefficient associated with slip rise time, and calculates ground motion under regional conditions.
Rise time is the time taken for a location on the fault to complete its main slip. Even with similar final displacement, faster or slower movement changes the rhythm of energy release. The fault and terrain in the original figure place this underground action within its regional setting.
Imagine the fault plane as many small areas that begin moving in sequence, each with its own slip history. A surface waveform combines their contributions after travel along different paths. Adjusting rise time changes how quickly each local action develops. This alters the proportions of different frequency components, which can then change regional peaks and the area of strong shaking. Source-time parameters thus leave recognizable signatures at the surface.
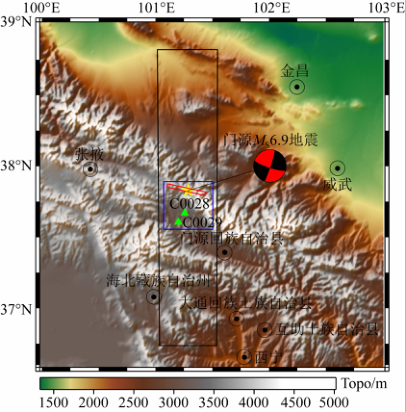
Compare the simulations with observations
The study compares rise-time coefficients including 1.6, 4.5 and 9, examining amplitudes, waveforms and regional intensity distributions against station records, attenuation relationships and intensity data. Each type of evidence serves a different purpose: station records provide the time history at a particular location, while regional distributions help assess the overall affected area.
Under the model and comparison conditions in the paper, larger rise-time coefficients produce results closer to several observed characteristics. Increasing the coefficient also reduces the simulated area of strong effects, showing the influence of the source-time process on regional ground motion.
Why compare amplitude, waveform and intensity distribution together? They test different scales. A station peak indicates local motion strength, a complete history checks the timing and duration of major shaking, and regional intensity describes the spatial pattern. A parameter setting that performs consistently across these comparisons has stronger physical support. The paper uses this complementary evidence to discuss the suitability of GP model parameters for the Menyuan earthquake.
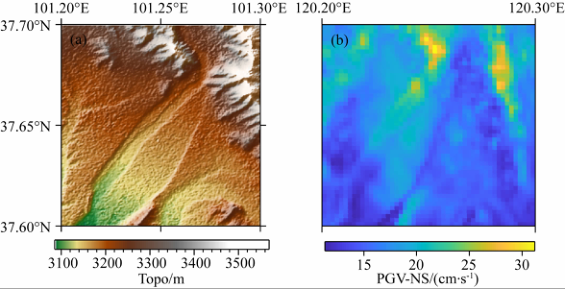
Give regional shaking a traceable origin
Behind a ground-motion map lie fault rupture, propagation paths and terrain. Connecting these stages helps explain why some locations shake more strongly and which model settings need observational constraints.
Testing against a past earthquake builds evidence for physics-based regional ground-motion simulation. Such work supports engineering inputs with explicit sources, parameters and physical relationships.
It also helps separate influences within a simulation: the source governs energy release, underground media affect propagation speed and attenuation, and terrain can modify motion locally. Researchers can vary or hold these stages fixed to trace changes in the regional map. The engineering result is more than a peak number: it is an earthquake scenario with an explainable origin, ready to be related to the locations of bridges, tunnels and other structures.