On a map, a tunnel meeting a fault looks like two intersecting lines. Underground, that intersection faces a much more complicated movement.
During an earthquake, the surrounding rock vibrates, and the two sides of the fault may retain a permanent relative offset. A tunnel buried in that rock must deform with it. This raises a direct question: how do forces and deformation differ when a tunnel crosses a fault obliquely rather than almost at right angles?
Using the Second Jiaozhou Bay Subsea Tunnel in Qingdao as the engineering setting, we compare six tunnel alignments. A striking consequence of changing the angle is a redistribution between tensile–compressive and shear deformation.
First, how do the tunnel and fault meet?
The tunnel in this project lies above the top of the fault and intersects the Cangkou Fault in plan projection at an actual angle of 27°. Seismic waves and rock displacement caused by fault rupture travel to tunnel depth, moving the surrounding rock and tunnel together.
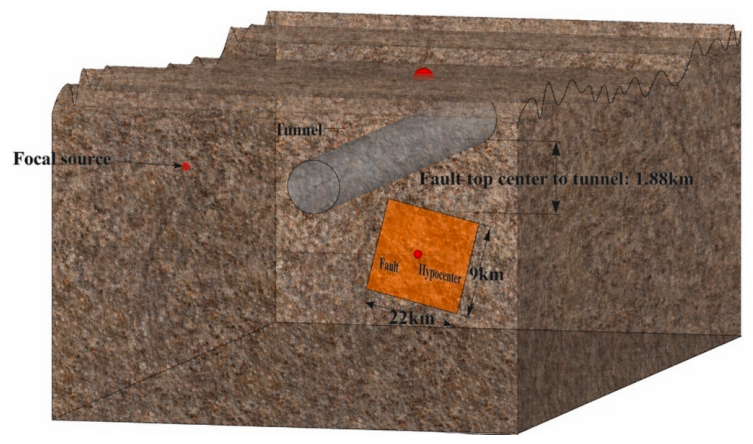
Figure 1 | How do the tunnel and fault meet underground? The grey tubular structure is the tunnel, and the orange area is the fault plane. The tunnel lies above the top of the fault. Source: paper Fig. 6.
Imagine the tunnel as a long pipe buried in rock. Different rock movements along its length pull it in different directions: some sections lengthen, some shorten, and shear deformation also develops.
The paper describes these local changes using strain. Normal strain represents stretching or compression, while shear strain describes local angular distortion. These measures need to be considered together to understand the tunnel’s deformation process.
Normal strain can also be examined in different directions. Longitudinal strain describes lengthening or shortening along the alignment; circumferential strain describes tension and compression around the cross-section. Shear strain captures local skewing of shape. Like different views of the same movement, individual components reveal the principal mechanisms, while their combination explains the demands carried by different parts of the lining.
Rotating the tunnel in a computer model
The study begins with fault rupture and simulates ground-motion propagation across the region. A modified domain reduction method then transfers motion from different locations along the alignment into a tunnel-and-surrounding-rock model. The numerical tunnel therefore receives spatially varying seismic input.
We then keep the source and regional-site models fixed and rotate the tunnel around one reference point, producing six intersection angles: 12°, 27°, 42°, 57°, 72° and 87°.
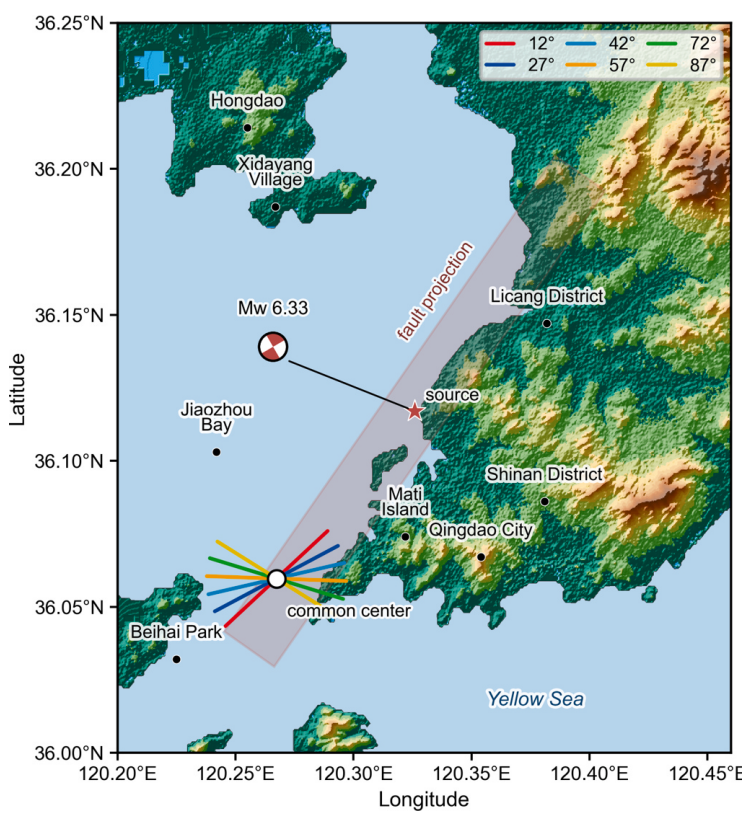
Figure 2 | Six directions for the tunnel. The coloured lines represent six alignments rotated around the same reference point; the translucent band marks the surface projection of the fault. Source: paper Fig. 7.
Rotating the tunnel also changes its position within the ground-motion field. The intersection angle and the inputs along the alignment change together, creating six engineering scenarios for comparison.
This comparison retains one regional source setting while allowing the tunnel to receive rock motion along different paths. Displacement differences between neighbouring locations and the proportions of motion in different directions can both change with alignment. The modified domain reduction method connects the regional and local tunnel models, transferring these spatial differences into the surrounding rock and lining so that the six alignments can be compared in relation to their specific input conditions.
Different deformation components take the lead
The 42° case is particularly revealing: it has the smallest shear strain, but relatively large circumferential and longitudinal normal strains. Deformation in this case is expressed more strongly through stretching and compression.
At 57°, normal and shear strains both remain appreciable, and equivalent strain—the combined measure of local deformation—reaches its maximum among the six cases. The 12°, 72° and 87° cases show larger shear strains.
Together, these results reveal a clear pattern: as the angle changes, individual deformation components rise and fall differently, changing the way the tunnel deforms.
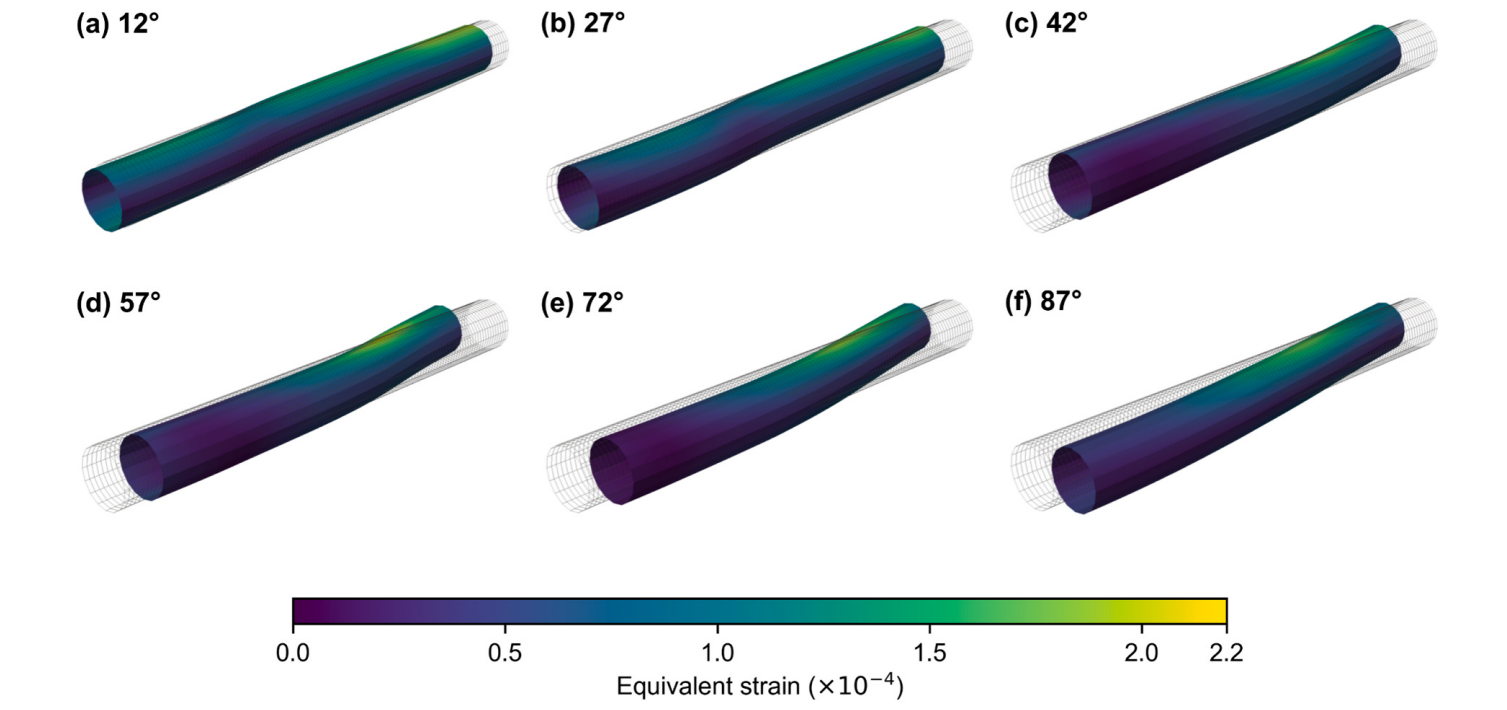
Figure 3 | Comparing deformation across the six alignments. The grey mesh is the original shape; coloured surfaces show the deformed tunnel lining, with equivalent strain increasing from purple to yellow. All six panels use the same colour scale and show each case at its reference peak time. To make deformation visible, the original figure compresses the longitudinal dimension to 3% of its geometric scale and magnifies displacement 80 times. Source: paper Fig. 13.
The figure also shows changes in the location and extent of high-strain regions. These distributions help engineers identify lining areas that deserve particular attention in design.
To read the panels, first locate high values on the common colour scale, then compare how far they extend along the tunnel and where they lie around the cross-section. Finally, relate them to the normal- and shear-strain results. The contrast between 42° and 57° is especially useful: a case with less shear can still have substantial tension and compression, while several components acting together can produce a larger combined measure. Asking which alignment is more favourable therefore requires knowing which deformation types the structure can accommodate and where the demands concentrate.
Choosing an alignment also means choosing a deformation combination
The study expands “At what angle should the tunnel cross the fault?” into several questions: how does the rock move along the alignment, which deformations dominate the tunnel’s response, and where do larger strains concentrate?
Under the engineering conditions considered here, the six alignments differ mainly in their combinations of normal and shear strain. Connecting these components and their spatial distributions to structural capacity provides more specific guidance for tunnel alignment and seismic measures.
A line on a map connects a much richer movement underground—one involving the source, rock and structure together. Understanding that movement helps explain the tunnel’s seismic performance.
Publication details
Title: Influence of tunnel-fault intersection angle on the seismic deformation mode of a large-span cross-fault subsea tunnel
Authors: Yang Gao, Ke Zhang, Hao Wang, Zerui Ji, Chao Luo (corresponding author)
Journal: Tunnelling and Underground Space Technology, 179 (2027), 108146
DOI: 10.1016/j.tust.2026.108146
Full text: Download PDF